
Welcome to the first article, really more of an op-ed, in the homelab monitoring series. Where I incorporate the lessons learned from both at home and from work to continue building out my monitoring stack.
Or, as I like to call it… Congratulations, you have a monitoring stack! Now what?
The first step is to surface all the metrics you can get your hands on and visualizing them. Next up are alerts and notifications. Which gives way to customizing, updating, and tidying up your dashboards.
The monitoring journey is a marathon and not a sprint. Pace yourself and work on one or two related parts at a time. Remind yourself that something is better than nothing and to not lose hope when faced with some truly fantastic community examples.
The maturity of the solutions described in this series are on their second and third iterations, with some entering their third year of service.
Monitor Everything: Collect All Metrics
Going forward, this article assumes that you have already configured both Prometheus and Grafana. There is already an excellent Unraid guide on setting up monitoring with Prometheus and Grafana.
A good practice is to expose metrics as you deploy new services. I still love finding out when a new service already includes Prometheus metrics and enabling them is a simple matter of flipping a switch and adding some config.
Security top tip, make sure that any metrics endpoints are not publicly exposed to the Internet and if they are part of a publicly available service that they are password protected.
My strategy when implementing a new service
- Look for built-in metrics.
- A lot of applications already include a Prometheus metrics stream that simply needs to be enabled.
- Is there a Prometheus exporter available?
- An exporter taps into a service’s metrics and translates them into a Prometheus compatible endpoint.

In practice, the majority of my services use Prometheus or OpenTelemetry, with some exceptions. InfluxDB is another popular time series datastore and alternative to Prometheus.
Examples of where I use InfluxDB are:
- My pfSense firewall uses Telegraf and stores its telemetry in InfluxDB 1 using VictorRobellini’s pfSense Dashboard.
- The Internet speed test tracker uses InfluxDB 2.
- The Octopus energy tracker I recently forked.
What Is Observability?
Terms like Monitoring and observability are easily thrown around, especially in marketing.
For me, monitoring is the more physical aspect of instrumenting and exposing metrics. This also includes other signals as well as log collection.
Observability on the other hand is extracting the knowledge and context from those metrics to create a narrative that feeds into everything from a picture of system health all the way to high-level Service Level Objectives (SLO).
The goal of observability is to determine the health and state of the platform and application stack without having to peel away layers of metrics and dashboards. This is where custom metrics come in to play to measure things like active user counts and building a high-level view of the application’s behaviour.
Put simply, the goal of observability is to answer the following questions. Can you measure how the application stack is being used and how well it is performing?
Opinionated Monitoring
Since 2018, my day job has kept me busy working with and deploying a variety of cloud infrastructure and working with multiple monitoring systems. In that time I have developed a sense of what monitoring stacks worked well and those that I found harder to work with.
To me, opinionated monitoring represents a platform that has a well-defined set of integrations and out-of-the-box dashboards that enable users to immediately consume and visualize their metrics. Providing an easy-to-use interface is a must because it encourages customization and learning by doing. Combine the above with solid documentation and you have a recipe for success.
A positive vendor experience worth mentioning is DataDog. This to me is a good example of opinionated monitoring and has conceptually helped me with how I approached monitoring in my homelab. The built-in dashboards helped to reinforce a variety of concepts such as templating and variables, that gave me the confidence to take the plunge with building out an open source homelab monitoring stack.
A managed solution is not suitable or in the spirit of a homelab, not to mention it can cost a small fortune if not managed responsibly. Coinbase’s $65M DataDog bill is a good read.
When the time came to adopt Grafana, my experiences with DataDog made it easier to carry that knowledge and experience over and having predefined ideas of what I wanted to build.
I love the variety of Grafana community dashboards available and how easy it is to get up and running. To me, this represents the right kind of opinionated monitoring by curating useful metrics, showing what is possible, and providing good out-of-the-box functionality.
The community dashboards are an excellent starting point and enable you to instantly generate value from your metrics. While they might have some rough edges, or cover every use case. They do give you enough to get started and most importantly, something to learn from. Those same rough edges are learning opportunities to edit a panel, find out why a query is not returning data and ultimately fix it.
What these approaches achieve, besides providing a faster path to monitoring, is allowing you to see the metrics and queries in motion. Making it easier to deconstruct and start writing your own queries and aggregations.
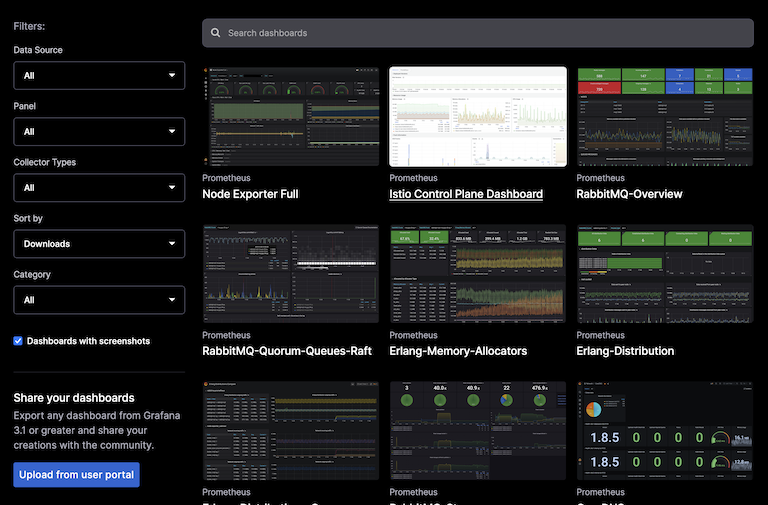 The Grafana community dashboard search page.
Some Assembly Required
If this sounds opinionated, it is, and for good reason. During my time of building, using, and consuming various monitoring products, I have encountered a recurring problem. A lack of contextual opinion.
- Consultants providing generalized advice about the kinds of monitoring you might want to look at.
- A lack of monitoring literature that takes a “do this and monitor that, because X, Y, Z” approach. In other words, an opinion.
- More access and better documentation around core features that are better suited to entry level users.
A big part of the above is the need to sell their consulting services without giving too much away in the initial round, which is still paid for. I am not a huge fan of putting knowledge behind a paywall, or else this site wouldn’t exist.
Some more handholding to get teams and engineers started with their monitoring solutions is a net positive. If anything, this would be a great demonstration of the monitoring product’s solution and value.
With the constant drum of security breaches, usually accompanied by a lack of detection. Surely it would be better for everyone involved to increase the rate of adoption of monitoring standards by making knowledge more widely available.
Growing Pains
I do think that a lack of opinion in a monitoring platform can lead to a lot of time spent trying to make something work. Coupled with only basic out the box metrics and little context about how more advanced features work.
I need to call out my time with Azure Monitor here. While this experience does date back to 2020/2021, I constantly felt like I was fighting against a steep learning curve*.
- Learning Azure’s proprietary Kusto Query Language (KQL) to parse logs.
- Sifting through unclear documentation on instrumenting and configuring application monitoring.
- Deploying and sharing queries and dashboards across teams.
- Cost control, it is not a cheap monitoring solution.
While I ultimately did figure out and overcome the above. There were stark differences with how comparatively easy it was to build out similar functionality on other platforms, both closed and open source.
I suspect I am not the only person here that learns by doing and that relies on finding good examples to work from.
I think this comes down to having good examples to emulate and reverse engineer to gain a better understanding. That certainly helped me to build a foundation and start finding my own way.
Engineers today come from all kinds of backgrounds. Not all of whom hail from big math-brained disciplines that see the world in code and numbers, myself included. I need a more hands-on approach when working with coding structures to get a feel for it, also I don’t have a computer science degree.
Disclaimer:
- I still primarily use Azure at work, with DataDog on monitoring duty.
- Grafana is used in another part of that estate that uses Google Cloud Platform.
- A separate external product is used for application logging.
- Azure Log Analytics has its uses for capturing and storing audit logs used for security and compliance.
The message here really should be that it is okay to use the right software for the right reasons. Do not feel obligated to tie yourself down to a single solution. Sometimes combining multiple products is both more cost and time effective, while also delivering superior results.
Getting Started
I started with the essentials by surfacing the Unraid host metrics using Prometheus Node Exporter plugin. If you are in the business of running Docker containers, I highly recommend cAdvisor. This configuration enables per container metrics and allows you to compare relative resource usage between containers relative and the host machine.
Unix treats each core and thread as 100%, an eight core system would therefore have 800% CPU capacity, or 1600% if the processor is multithreaded. The node exporter dashboard expresses CPU on a scale of 0-100%. While cAdvisor Docker metrics show Unix relative CPU usage and a container can report usage greater than 100%, meaning that it is using more than one core’s worth of compute. It is useful to make side by side comparisons to see how the reported container CPU utilization measures against the host’s total CPU.
Alerting
Initial alerting passes should, at the very least, notify you if a service is down. From here, the goal of an alert is to notify you potential issues before they significantly impact a service.
Google’s Site Reliability Engineer book discusses the four golden signals and monitoring for a service’s latency, traffic, errors, and saturation. Capture metrics for these signals and use them to build alerts.
For example:
- A high rate of 50x errors.
- A spike or sustained increase in latency or response times.
- An increase in overall requests.
- Higher bandwidth usage.
All of the above can be indicative of a potential problem or change in a service’s behaviour. As your monitoring environment matures you will be able to better correlate user or system driven events to distinguish a change from an issue.
What is next in this series?
I have mostly completed a second pass on alerting in my homelab in addition to adding more dashboards.
The next article in this series will focus entirely on getting started with dashboards and examples of what I am using and which services I am monitoring.
Further down the line we will visit what I have in the ways of alerting and notifications, as well as logging. Logging in particular is very much a work in progress and currently falls under three categories:
- Manual Docker logs.
- Logs being sent to Loki.
- Crowdsec parsed logs used for network security.
If you have made it this far, thank you for reading and I hope you have enjoyed the first part in the series!