
I set up a UPS monitoring server with NUT and Grafana, allowing me to monitor my homelab’s power state and usage over time with Grafana. Doing so has helped me make a few tweaks to my homelab in order to reduce its overall power footprint. I have also pointed my Synology NAS and Unraid server at the NUT server so they can safely shutdown in the event of a power outage.
While I configured this on a Raspberry Pi with Docker, you can also install NUT locally or even install the Unraid app for a quick and simple setup.
Prerequisites
- A running Prometheus instance with a
prometheus.yamlconfiguration file in order to consume the UPS metrics. - (Optional) For the dashboard, a running Grafana instance.
Configuring NUT in Docker
Before starting, first identify which USB port the UPS is connected to by running lsusb.
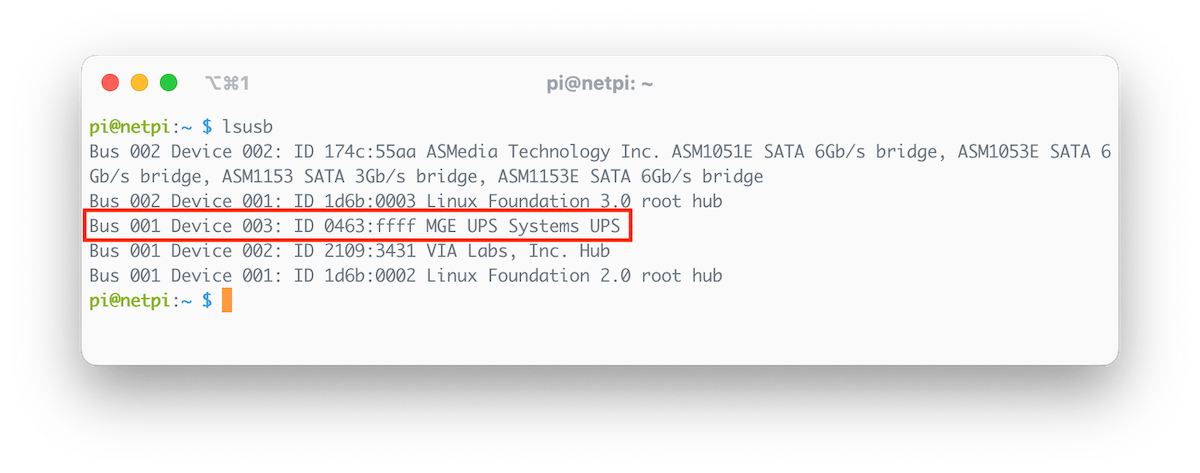
In my case the UPS is showing up as MGE UPS Systems UPS and it’s using bus 001.
There are a number of different Docker images for NUT. I tried a few with varying levels of success, but in the end I found instantlinux/nut-upsd worked the best and provided the most complete metrics. With that said, it still has some quirks. Adding any additional environment variables causes a generic configuration error and stops the container. Likewise when starting the container without a secrets file, or leaving it blank.
Create a Docker compose file with the following:
version: '3.9'
services:
  nut-upsd:
    image: instantlinux/nut-upsd
    container_name: nut-upsd
    environment:
      - TZ=Europe/London
      # Driver found with this tool https://networkupstools.org/stable-hcl.html
      - DRIVER=usbhid-ups
    devices:
      # Only pinning to the bus as the device number can change
      - /dev/bus/usb/001:/dev/bus/usb/001
    ports:
      - "3493:3493"
    secrets:
      - nut-upsd-password
    restart: unless-stopped

secrets:
  nut-upsd-password:
    # Place this where you like, but you may want to read up on securing password files: https://docs.docker.com/compose/use-secrets/
    file: ./nut/nut-upsd-password
A few points to note:
- Depending the UPS model, a different driver may be required. This can be found using the NUT hardware compatibility lookup tool here.
- Update the bus under devices,
/dev/bus/usb/001to the value outputted by thelsusbcommand. Note it does not use the device number and this value may change following a reboot. - I have added a secrets file in a
./nutdirectory, this can be placed anywhere. I’ve set this to a random string as it is not used in this guide, however the container requires it to run correctly. I recommend checking the Docker documentation for best practices with secrets in Docker compose. - If you are using an APC UPS the serial may be needed, using the
SERIAL=YOURSERIALenvironment variable.
Starting the container up with docker compose up, you should see something similar this:
** This container may not work without setting for SERIAL **
Network UPS Tools - UPS driver controller 2.8.0
Network UPS Tools - Generic HID driver 0.47 (2.8.0)
Using subdriver: MGE HID 1.46
USB communication driver (libusb 1.0) 0.43
Network UPS Tools upsd 2.8.0
Ignoring invalid pid number 0
listening on 0.0.0.0 port 3493
Connected to UPS [ups]: usbhid-ups-ups
Network UPS Tools upsmon 2.8.0
  0.000000	Ignoring invalid pid number 0
  0.000825	Using power down flag file /etc/killpower
  0.001016	UPS: ups@localhost (primary) (power value 1)
  0.001112	[D1] debug level is '1'
  0.001503	[D1] debug level is '1'
  0.002393	[D1] Saving PID 25 into /var/run/upsmon.pid
Init SSL without certificate database
  0.006940	[D1] Trying to connect to UPS [ups@localhost]
  0.008499	[D1] Logged into UPS ups@localhost
To test it’s running properly and returning data, it’s time to break out ye olde telnet protocol, using telnet [NUT_SERVER_IP] 3493 to connect. Once connected, enter LIST UPS to check the UPS is found, and LIST VAR [UPS_NAME] to list the metrics.
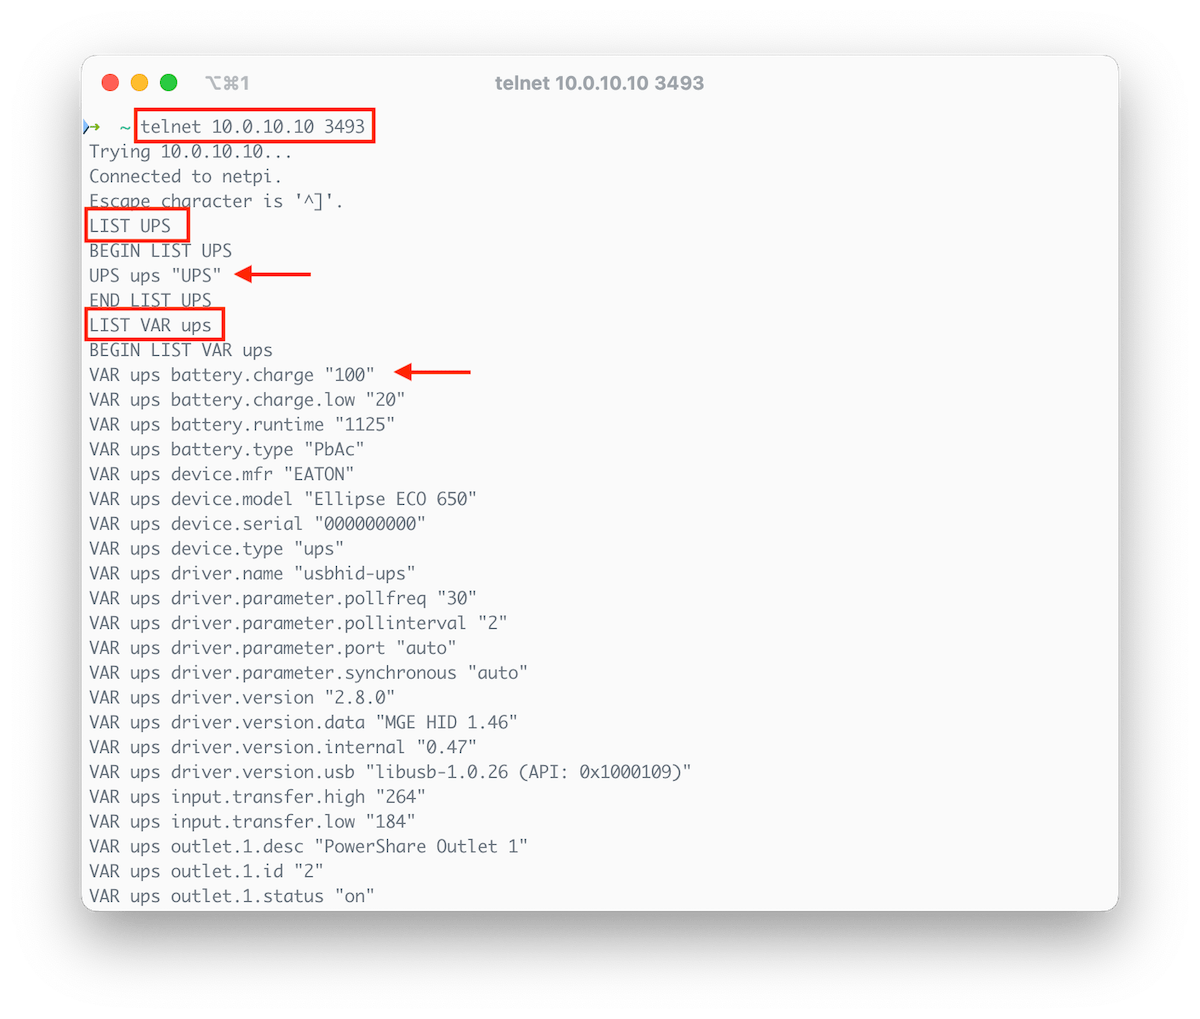
Taking a scroll through you should see some metrics that seem familiar, such as the make and model of your UPS.
Getting NUT setup in Prometheus and Grafana
Now the NUT server is running, let’s add the NUT exporter so we can see the data in Prometheus and Grafana. I have opted to use the following container hon95/prometheus-nut-exporter as it has good documentation and a nice Grafana template that’s ready to go.
Add the following NUT exporter configuration to the existing Docker compose file:
  nut-exporter:
    image: hon95/prometheus-nut-exporter:1
    container_name: nut-exporter
    environment:
      - TZ=Europe/London
      - HTTP_PATH=/metrics
    ports:
      - "9995:9995"
    depends_on:
      - nut-upsd
    restart: unless-stopped
The resulting file should look similar to this:
version: '3.9'
services:
  nut-upsd:
    image: instantlinux/nut-upsd
    container_name: nut-upsd
    environment:
      - TZ=Europe/London
      # Driver found with this tool https://networkupstools.org/stable-hcl.html
      - DRIVER=usbhid-ups
    devices:
      # Only pinning to the bus as the device number can change
      - /dev/bus/usb/001:/dev/bus/usb/001
    ports:
      - "3493:3493"
    secrets:
      - nut-upsd-password
    restart: unless-stopped

  nut-exporter:
    image: hon95/prometheus-nut-exporter:1
    container_name: nut-exporter
    environment:
      - TZ=Europe/London
      - HTTP_PATH=/metrics
    ports:
      - "9995:9995"
    depends_on:
      - nut-upsd
    restart: unless-stopped

secrets:
  nut-upsd-password:
    # Place this where you like, but you may want to read up on securing password files: https://docs.docker.com/compose/use-secrets/
    file: ./nut/nut-upsd-password
Once again, start the stack with docker compose up. Now the NUT exporter should be visible from a browser by going to http://[NUT_EXPORTER_IP]:9995/metrics?target=nut-upsd:3493. You should see a page with all the available metrics.

Prometheus
In the prometheus.yaml configuration file, add the NUT exporter job:
- job_name: 'nut-exporter'
    honor_timestamps: true
    scrape_interval: 30s
    scrape_timeout: 10s
    metrics_path: /metrics
    scheme: http
    follow_redirects: true
    enable_http2: true
    static_configs:
      # NUT server address
      - targets: ['nut-upsd:3493']
    relabel_configs:
      - source_labels: [__address__]
        target_label: __param_target
      - source_labels: [__param_target]
        target_label: instance
      - target_label: __address__
        replacement: nut-exporter:9995
Note the use of container names to route requests, however these can be replaced with an IP address.
Restart Prometheus to pick up the new config.
Grafana
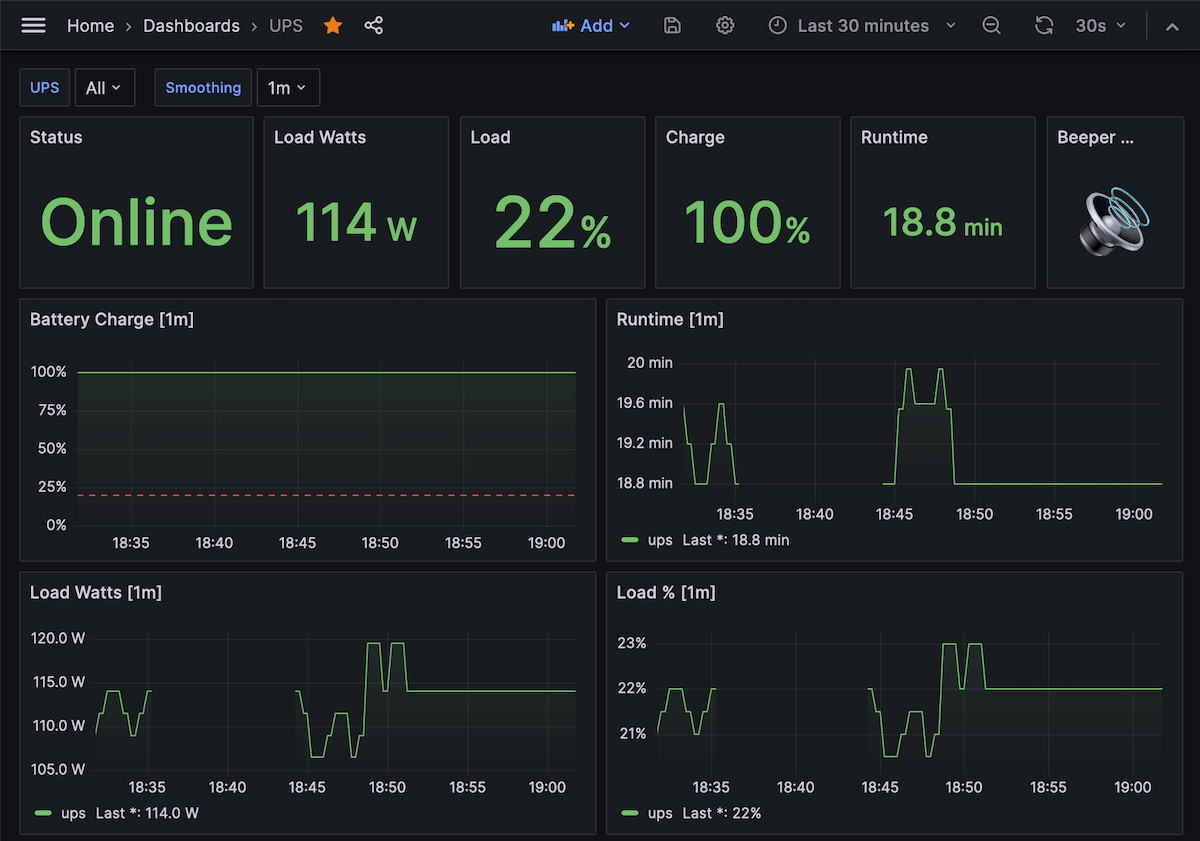
Import the example dashboard provided by author of the NUT exporter container found here, or with the ID 14371.
I’ve tweaked my dashboard a little to my liking, but that’s part of why Grafana is so great!
Configuring Unraid to use the NUT server
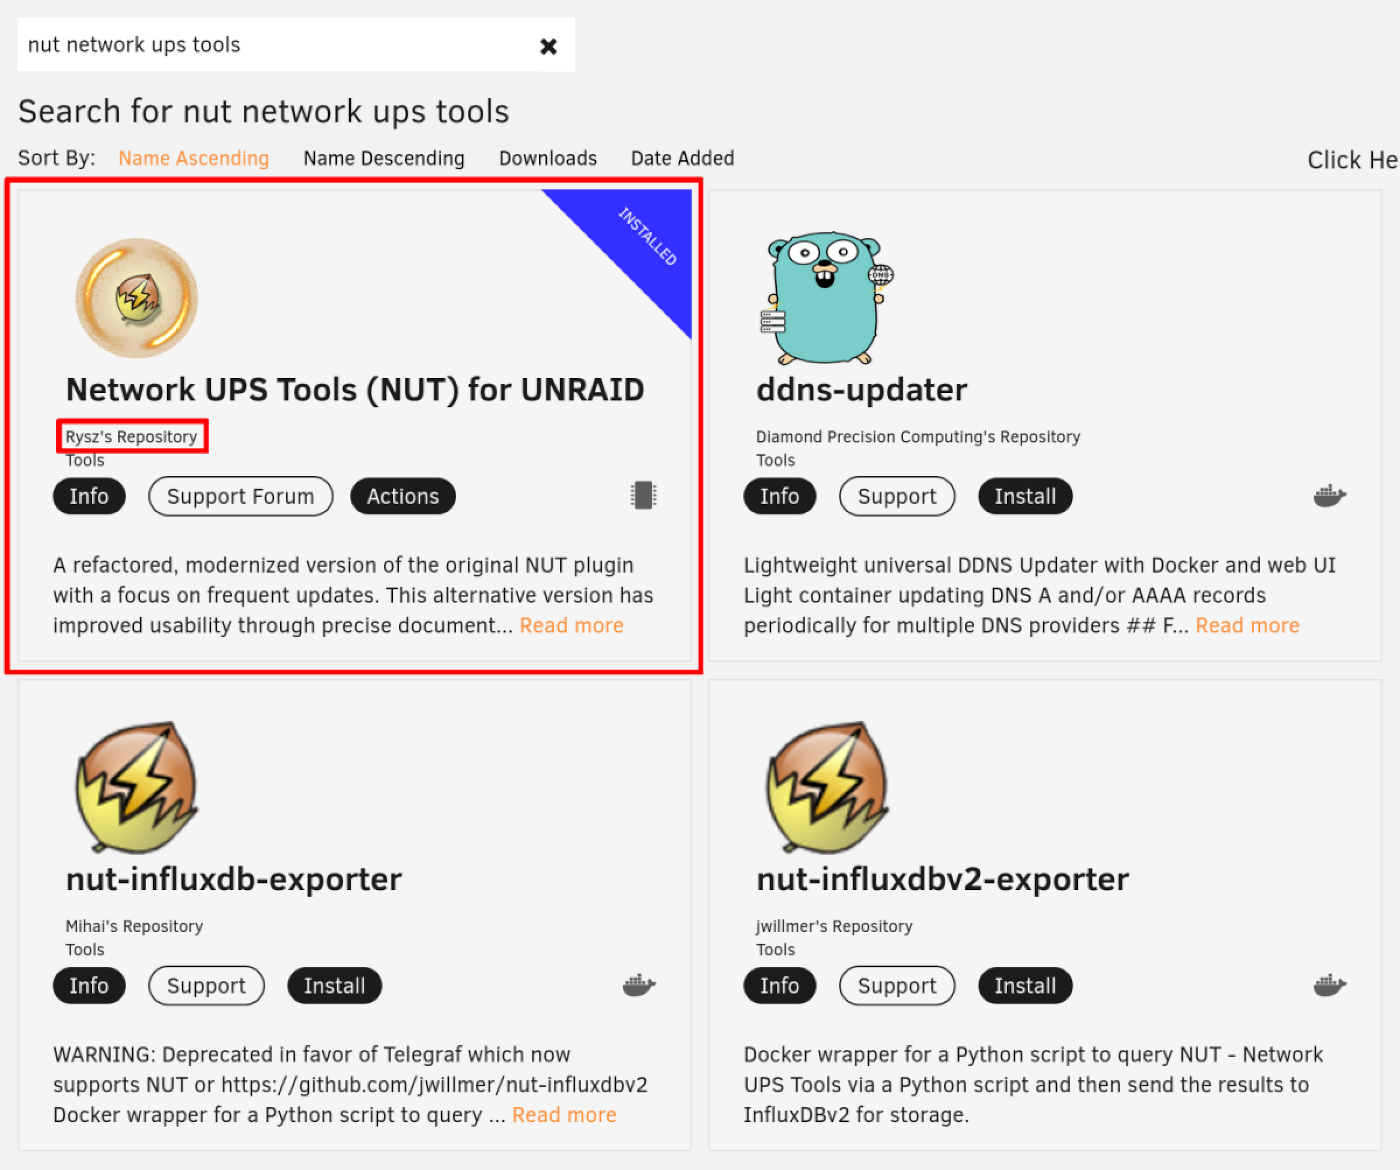
Unraid does have some UPS support out of the box when connecting the UPS directly via USB. However for it to work with a separate NUT server, a plugin called “Network UPS Tools (NUT) for UNRAID” by Rysz is needed. This plugin has a few bonus features such as showing the UPS status in the bottom of the Unraid window.
Once installed, it can be found as “NUT settings” under the Unraid Settings tab.
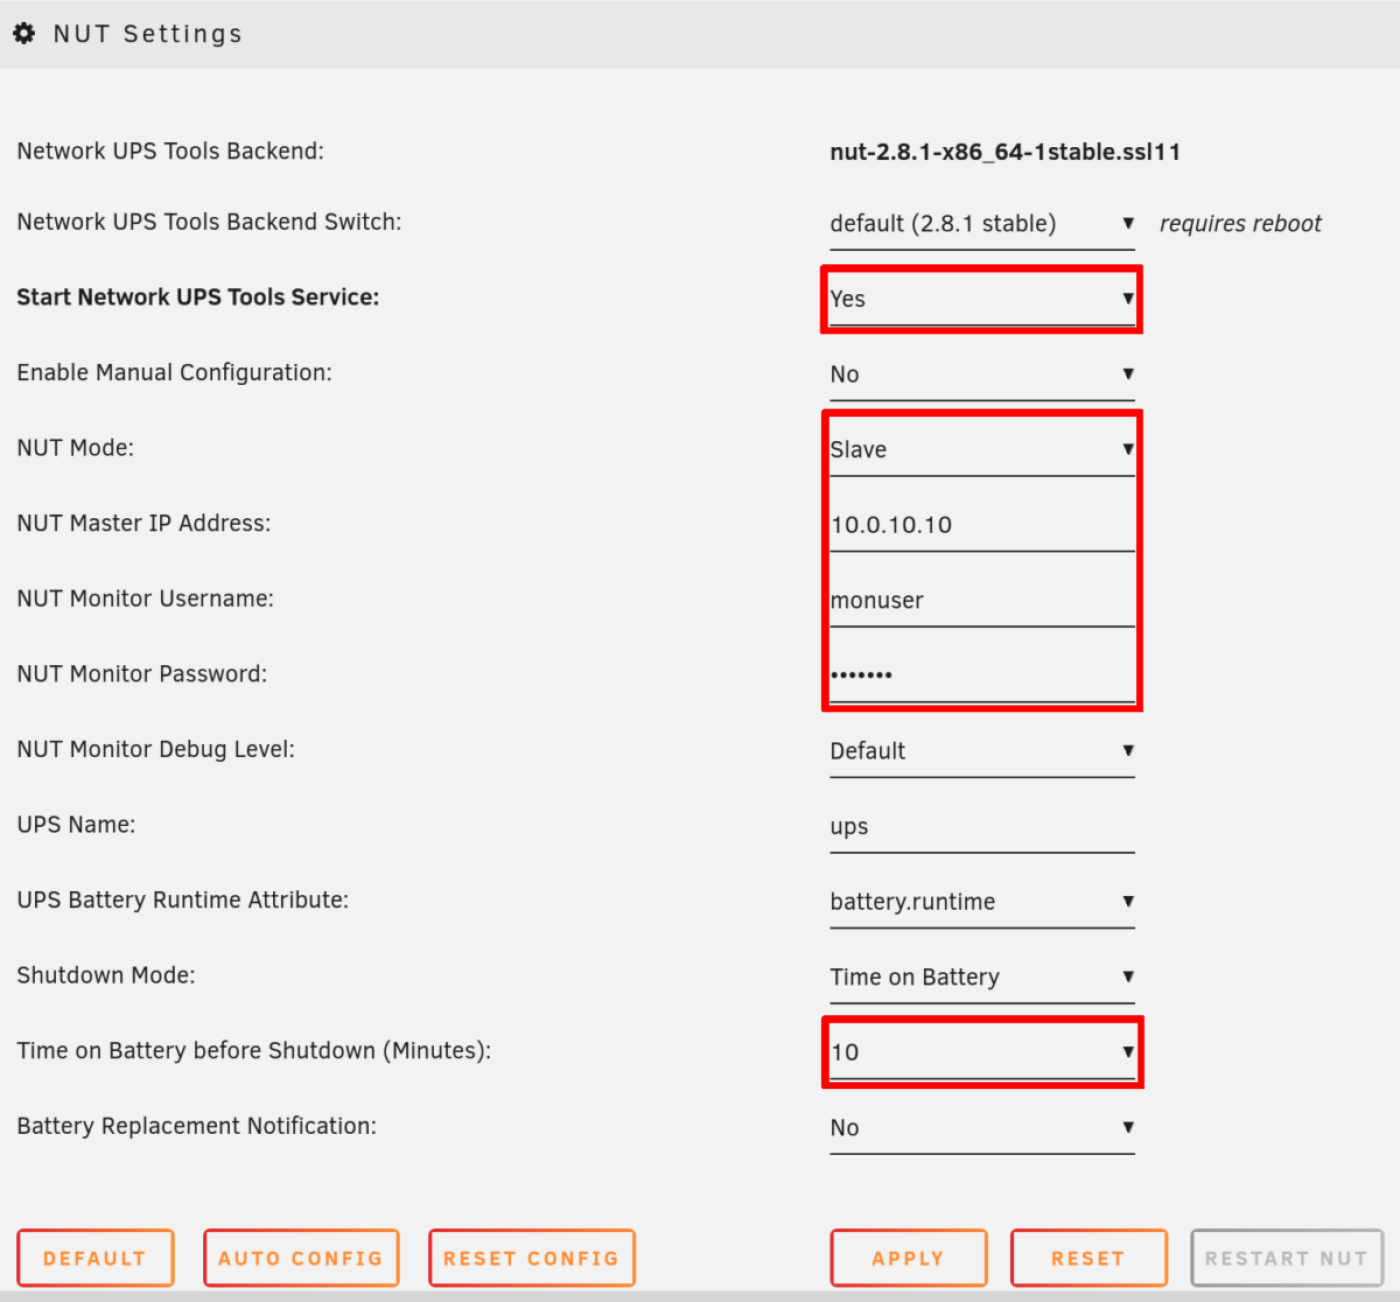
Set the options as follows:
- Start Network UPS Tools service: Yes - This runs the service.
- NUT Mode: Slave - Use slave mode to read from the NUT server.
- NUT Master IP Address: [NUT_SERVER_IP].
- Time on battery before shutdown (minutes): 10 - Tune this based on how much run time your UPS has. I have about 20 minutes, so at 10 minutes I want to shutdown.
- The other UPS settings I left blank or default, but you may want to change these.
Apply and the status in the top right should change to “Running”. Scroll down and you should see your UPS details. If not, Unraid was not able to connect to the NUT server and you will need to check the settings and potentially any firewall rules that may apply.
Configuring Synology to use the NUT server
Conveniently, Synology includes support for UPS’s out of the box. The UPS settings can be found in the “UPS” tab under “Hardware & Power” in the Synology settings.
Check the “Enable UPS support” box to edit the options.
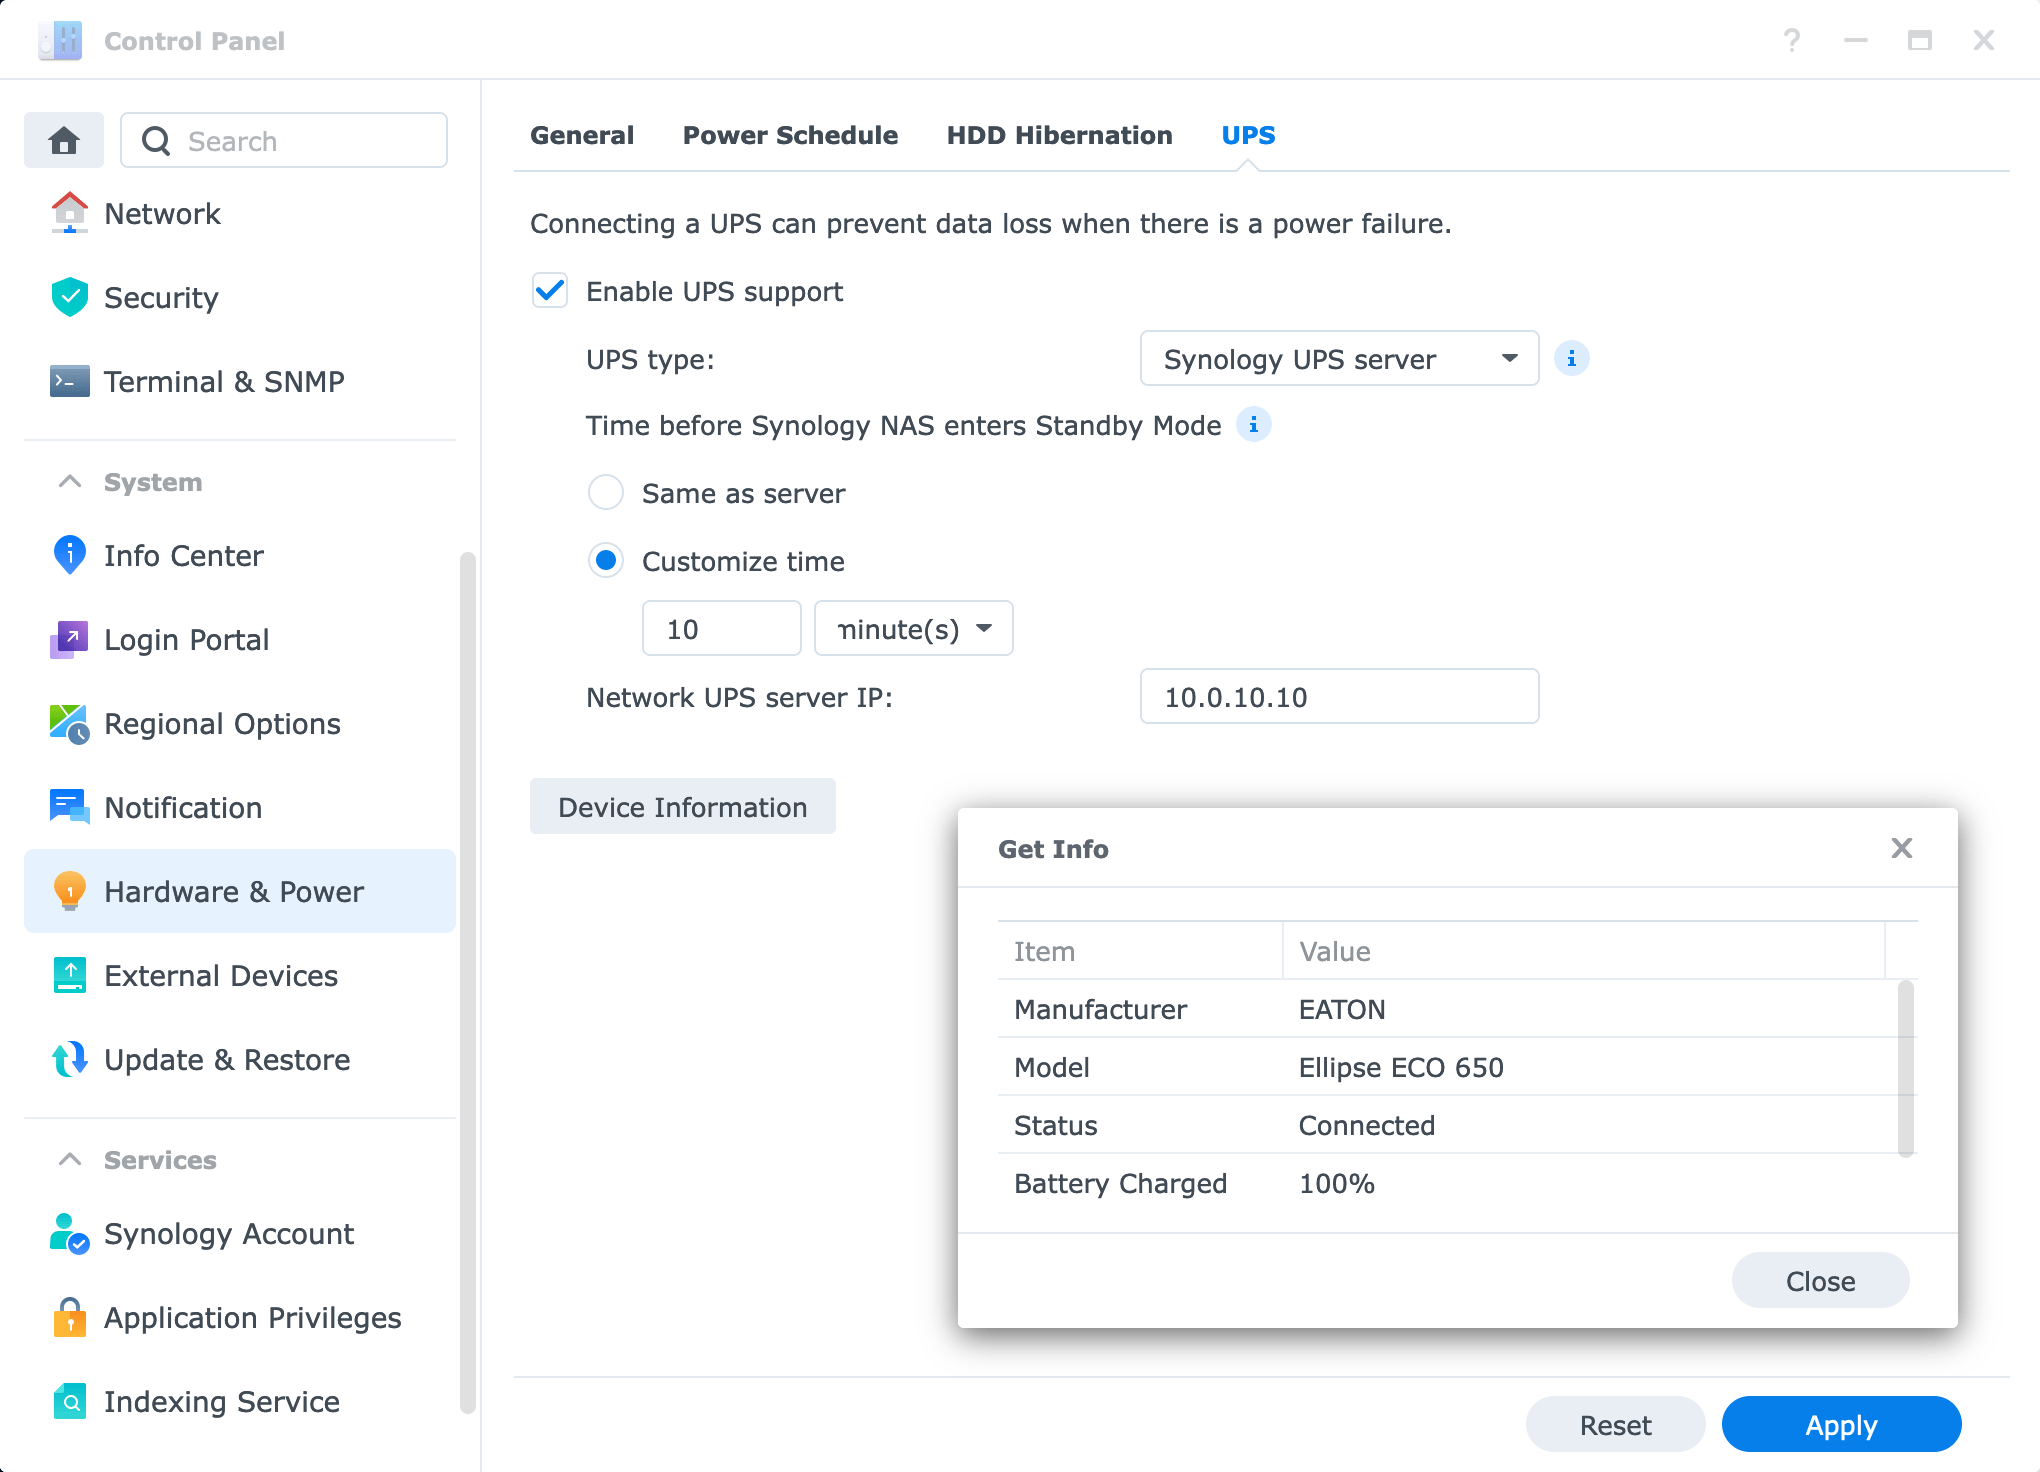
Set the following options:
- UPS Type: Synology UPS Server - This seems to work nicely out of the box.
- Time before Synology NAS enters Standby mode: Custom Time > 10 Minutes - Tune this based on how much run time your UPS has. I have about 20 minutes, so at 10 minutes I want to shutdown.
- Network UPS server IP: [NUT_SERVER_IP].
Apply and it should connect. You can check it is connected correctly by clicking the “Device Information” button and verifying the data shown.
Conclusion
Moving my UPS monitoring from Unraid to a Raspberry Pi with NUT server wasn’t necessarily needed, but has helped me create a separation of concerns. This Pi hosts my monitoring stack alongside Pihole, making it somewhat of a utility device. In addition, adding the UPS to my Synology NAS was plug and play, which was not the case when using Unraid.
Going forward, I intend to add a temperature sensor to the Pi for monitoring temperatures in my cupboard where my homelab is based. It can get a little toasty in there during the summer!
Edited 5 November 2023 - Updated the recommended Unraid plugin from “NUT - Network UPS Tools” by SimonF as it was deprecated in favour of Rysz’s drop in replacement “Network UPS Tools (NUT) for UNRAID”.

